BYOD
BYOD Demand Response
 EV Charging
 Incentive Processing
 Program Design
If you’re an energy nerd like me, you’ve been transfixed by the news these days. Record-breaking electricity demand in Texas, the potential for rolling blackouts in Indiana, and anticipated capacity shortfalls are just a few of the news items we’ve been closely monitoring. But what does it all mean and what can we do with this information? Electricity in Middle America has never been this interesting (although winter storm Uri in February 2021 upended the Texas electric grid for weeks). With all of that in mind, how can utilities enhance their grid resiliency?
Recently, the Midcontinent Independent System Operator (MISO) has experienced some serious summer peaking challenges. MISO (pronounced my-so, not me-so like the fermented bean paste that makes delicious soup) manages the electric grid that spans from Manitoba, Canada to Louisiana. There are 15 states and 1 Canadian province in MISO and 42 million people, which is part of North America’s complex but fascinating web of electrical systems.
Join us as we reflect upon MISO’s electricity resources, explain last week’s heatwave and its impacts, and share our optimism for distributed energy resources (DERs) to help support these stressed-out grids!
Energy Resource Transitions
As we mentioned, MISO spans a huge section of the central U.S., an area expected to get a surge of heat this summer. So what’s the big deal? In addition to unprecedented weather, the electric grid in Middle America is facing two additional challenges: less generation from fossil fuel power plants and not enough new generation from renewables.
Thermal Plants
Also known as fossil fuel power plants, thermal plants like coal- and/or gas-fired plants, are facing big-time challenges. For perspective, 12.6 gigawatts of coal are expected to retire in the U.S. in 2022 (6% of the coal-fired capacity available in 2021), and a number of those are in MISO.
Historically, MISO has relied on coal and gas for the majority of its capacity, so these retirements have a big impact on the system operator and the electric grid. If you want to get real nerdy, according to the U.S. Energy Information Administration (EIA), 3.8 gigawatts of electric generation nameplate capacity in MISO retired between January 2021 and February 2022, representing 2.5% of MISO’s current capacity of fossil fuel resources.
*Note: EIA data has a bit of a lag, so we are living in a February 2022 time capsule for the EIA-inspired factoids in this article.
The other major driver impacting fossil fuel power plant operation is the cost of fuel. Natural gas prices are up 90% since March 2022, while coal prices in 2022 have risen 40% in the U.S., making it much more costly to supply thermal plants with fuel than in recent years. When the costs of running these plants are higher, it may make these plants uneconomic to run in markets that compete with renewable energy generation and nuclear on their electric grid.
Not Enough New Generation
While renewable energy projects are moving right along, getting them from a proposal to operation takes a lot of time. Currently, MISO does not have enough new generation connecting to the electric grid in the near term to replace generation from fossil fuel power plants. While EIA data shows that MISO has 3.7 gigawatts (3,700 megawatts) of new electric generation planned to start operating between February to December 2022, only 275 megawatts (7%) of projects have finished construction, 2,946 megawatts (79%) are under construction, but 523 megawatts (14%) are not yet under construction and some projects don’t have regulatory approval yet.
What does this mean? Well, we’re not going to get 3.7 gigawatts of new generation in MISO in 2022. And that means that 2022 will not keep up with the rate of thermal plant retirements in 2021. And it’s also important to note that nameplate capacity for a coal or gas plant can generate more electricity than wind or solar farms because renewable energy is intermittent. So, MISO is incredibly under-resourced at a time with extreme heat that requires extreme electricity supply to keep air conditioners running and people alive.
Last Week’s Heatwave – A Three-Part Story
The current heatwave is already taking a toll on the Midwest’s electric grid. Last week, on June 12, St. Louis, Missouri hit a record-high temperature of 100 degrees Fahrenheit. Other areas of the Midwest neared 115 degrees. We’ll look at this heatwave through three elements: energy supply, energy prices, and blackouts.
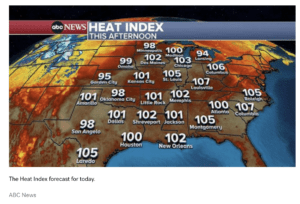
June 14 Heat Index: ABC News
1: Energy Supply Story
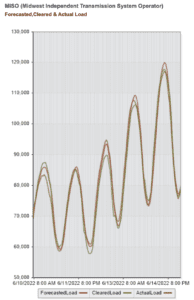
How did MISO deal with the additional electricity required to deal with this extreme heat? Not great. This chart from MISO tells the story (generated at this site).
In a computer-optimized scenario with no external risks, the lines of the graph above red (predicted electricity), green (available electricity supply), and brown (electricity demanded by customers) could be on top of each other. But in reality, MISO (and all system operators) wants to plan conservatively, with the available electricity supply (green line) above the electricity demanded (brown line).
The chart above shows that Saturday, June 11 got very close to the optimized scenario with the forecast very closely predicting actual demand and the available supply just meeting that demand–there is a very little gap between the three lines. But on Sunday, June 12 the brown line (demand) is way above the green line (supply). And it happens again during the day on Monday, June 13 before seemingly recovering on Tuesday, June 14. This is not good. It means that MISO was not able to serve the demand with their accessible supply.
And even as MISO updated its forecast (red) higher and higher each day to account for these crazy temperatures, the supply wasn’t able to respond quickly enough to meet the demand needed to balance the electric grid.
2: Energy Price Story
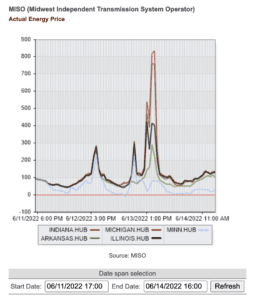
That’s our perspective on balancing the electric grid, what about electricity prices? We’ll focus on Indiana for this, but your basic economics comes into play here: high demand for a basic necessity + low supply = high prices.
Prices went totally through the roof on Monday, June 13, especially in Indiana (red line in the chart above, which was generated on this site). At 4 PM, the Indiana price for electricity (in $/megawatt-hour) was $836. In the past 4 years, the Indiana electricity pricing has never been that high. Last summer the highest it reached was about $600, and only 3 days got that high.
Curious about how this pricing works? It’s extremely complicated, but here’s a report from the Electric Power Research Institute (EPRI) if you want to dive deep into it. This pricing is the cost that energy providers are paying generators (in the wholesale market) to serve their customers electricity. Depending on where you live, that sometimes gets passed on to customers (this happened in Texas during Uri, although some were refunded), but in regulated markets, utilities must integrate the probability of something like this happening into standard electricity rates or request regulatory approval for special rate adjustments.
3: The Future is Blackouts
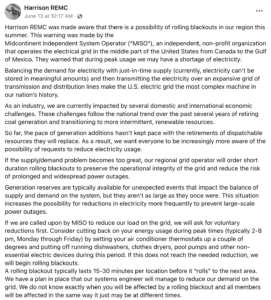
Between the low availability of electricity supply, the high demand for electricity, and the high prices of electricity, utilities are sharing some anxiety-inducing honesty with their customers: reliability within the electric grid is an enormous challenge right now! For example, Harrison REMC, a cooperative utility company in Indiana, shared this doomsday post on Facebook on June 13.
While scary and frustrating, this level of customer engagement may be what customers need to take the MISO summer capacity crisis seriously. Californians are used to being asked to conserve to avoid blackouts. Here’s a bold statement: no other industry relies on customer behavior and customer decision-making the way that a congested electric grid does.
Demand Response: An Underutilized Resource in Middle America
Since this story of stress on the grid is focused on the high peaks, demand management, and demand response (DR) offer a straightforward solution. But it’s underutilized, especially in MISO’s jurisdiction.
Out of the 42 million people that MISO serves, based on EIA’s data files, in 2020 fewer than 2 million customers are enrolled in a demand response program. Not surprisingly, the programs with the highest customer enrollments are from the biggest utilities (Xcel Energy in Minnesota and DTE and Consumers Energy in Michigan), but that doesn’t always lead to the biggest impact.
The biggest electricity savers in 2020 with their DR programs? According to the EIA data, it’s the cooperative utilities and the municipalities.
- Each saving more than 20 GWh of electricity in 2020, Great River Energy and Nodak Electric Coop are at the top of the list.
- Adams-Columbia Electric Coop, Wild Rice Electric Coop, City of Marshall, and Woodruff Electric Coop all saved more electricity than any investor-owned utility, the highest saver being Ameren Missouri.
When it comes to calling demand response events to shave peaks, there’s an even mix of investor-owned utilities (IOUs) and coops at the top of the list. Perhaps the coops and munis are using demand response to help customers save money, while the IOUs are focused on reducing the high energy prices during their highest demand peaks.
– Kirsten Millar, Director of Policy & Solutions Partnerships, Virtual Peaker
But any way you slice it, it’s clear that MISO and Middle America could use more demand response. More programs like Great River, who are seeing big impacts with, according to the EIA data, low price tags! EIA-861 Forms reveal that in 2020:
- Xcel Energy in Minnesota spent nearly $44 million on customer incentives and program costs for 422,000 customers to be enrolled and saved only 720 MWh.
- Great River Energy’s 287,500 customers in Minnesota saved 22,000 MWh and it only cost them $5.4 million.
- Nodak in North Dakota spent only $300,000 on its very successful demand response program.
How Can Demand Response Help?
If you’re new to demand response, these are programs that either ask customers to take action or directly control devices to reduce electricity demand and ease tensions to the electric grid. This can include managing air conditioning, water heaters, electric vehicles, batteries, and more. So during that high-priced period in Indiana (June 13 at 4 pm), Indiana utilities could have called on their customers to reduce demand (by turning up their thermostats 1-2 degrees or turning down their water heater temperature, or not charging their EVs and batteries) rather than spending huge amounts to buy that electricity from the energy market.
Unfortunately, Indiana doesn’t have many DR programs, with only 184,500 customers enrolled in 2020. And (this is very simplified and theoretical) if they all run programs with the rate of success that Great River Energy had in their “MWh to customers enrolled” ratio, in 2020 they could have saved 14,200 MWh but instead, they saved 1,800 MWh through their programs.
The one other tidbit of insight from the 2020 demand response in MISO data: residential customers on average seem to be under-incentivized for their energy reduction value. In MISO in 2020, residential customers across all demand response programs received about 38% of program incentive dollars but contributed 63% of energy savings (MWh) and 45% of peak demand savings (MW)–their commercial and industrial peers were paid more and had less energy saving impact on average.
What Now? MISO Energy Grid Conclusion
If you live in MISO, batten down the hatches for energy reliability issues this summer. Even without a utility-supported demand response program, you can take control of your energy use and decrease your usage on the hottest, hardest-to-supply electricity days of the year with smart devices, like thermostats, water heaters, batteries (especially when paired with rooftop solar), and electric vehicles.
If you’re a utility in MISO, call us! We can stand up a customer communication and/or demand response program quickly to get you connected to your customers and their equipment and then have the power (pun intended) to shave your demand at critical times. Not sure when your peaks might occur? We’ve got a load prediction tool to support you with that visibility, too.
Is Middle America the only area experiencing this strain? Not at all. Texas, California, and New England are all feeling the stress of congested grids. This summer will challenge us to think differently about managing load. We won’t say we told you so, but Virtual Peaker was designed to rise to this occasion. Seriously, call us!
Do you have the right demand response solution?