BYOD
BYOD Demand Response
 EV Charging
 Incentive Processing
 Program Design
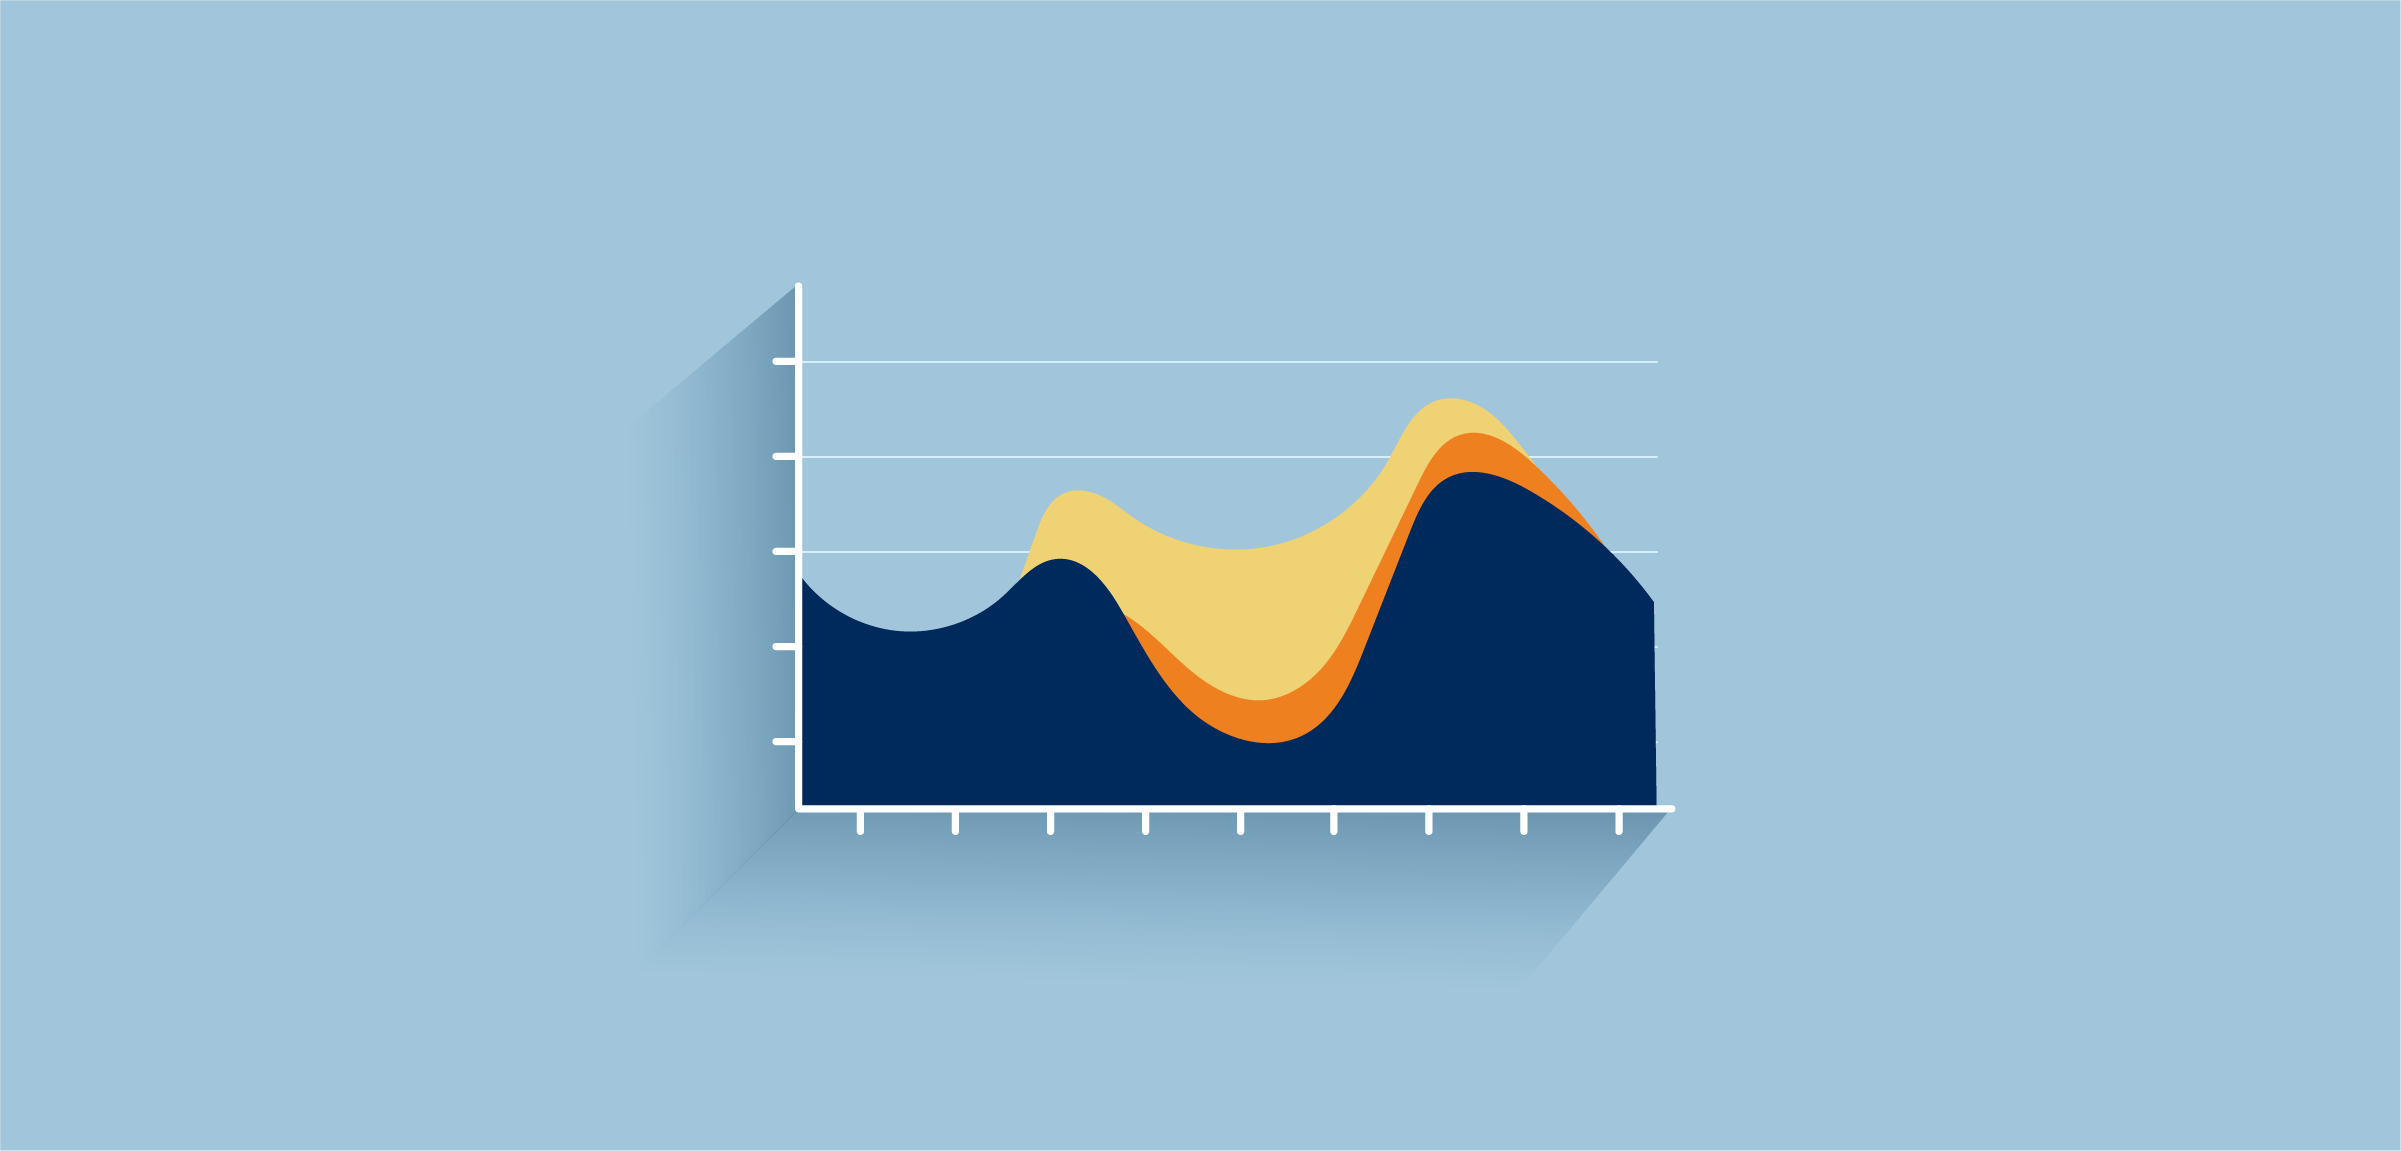
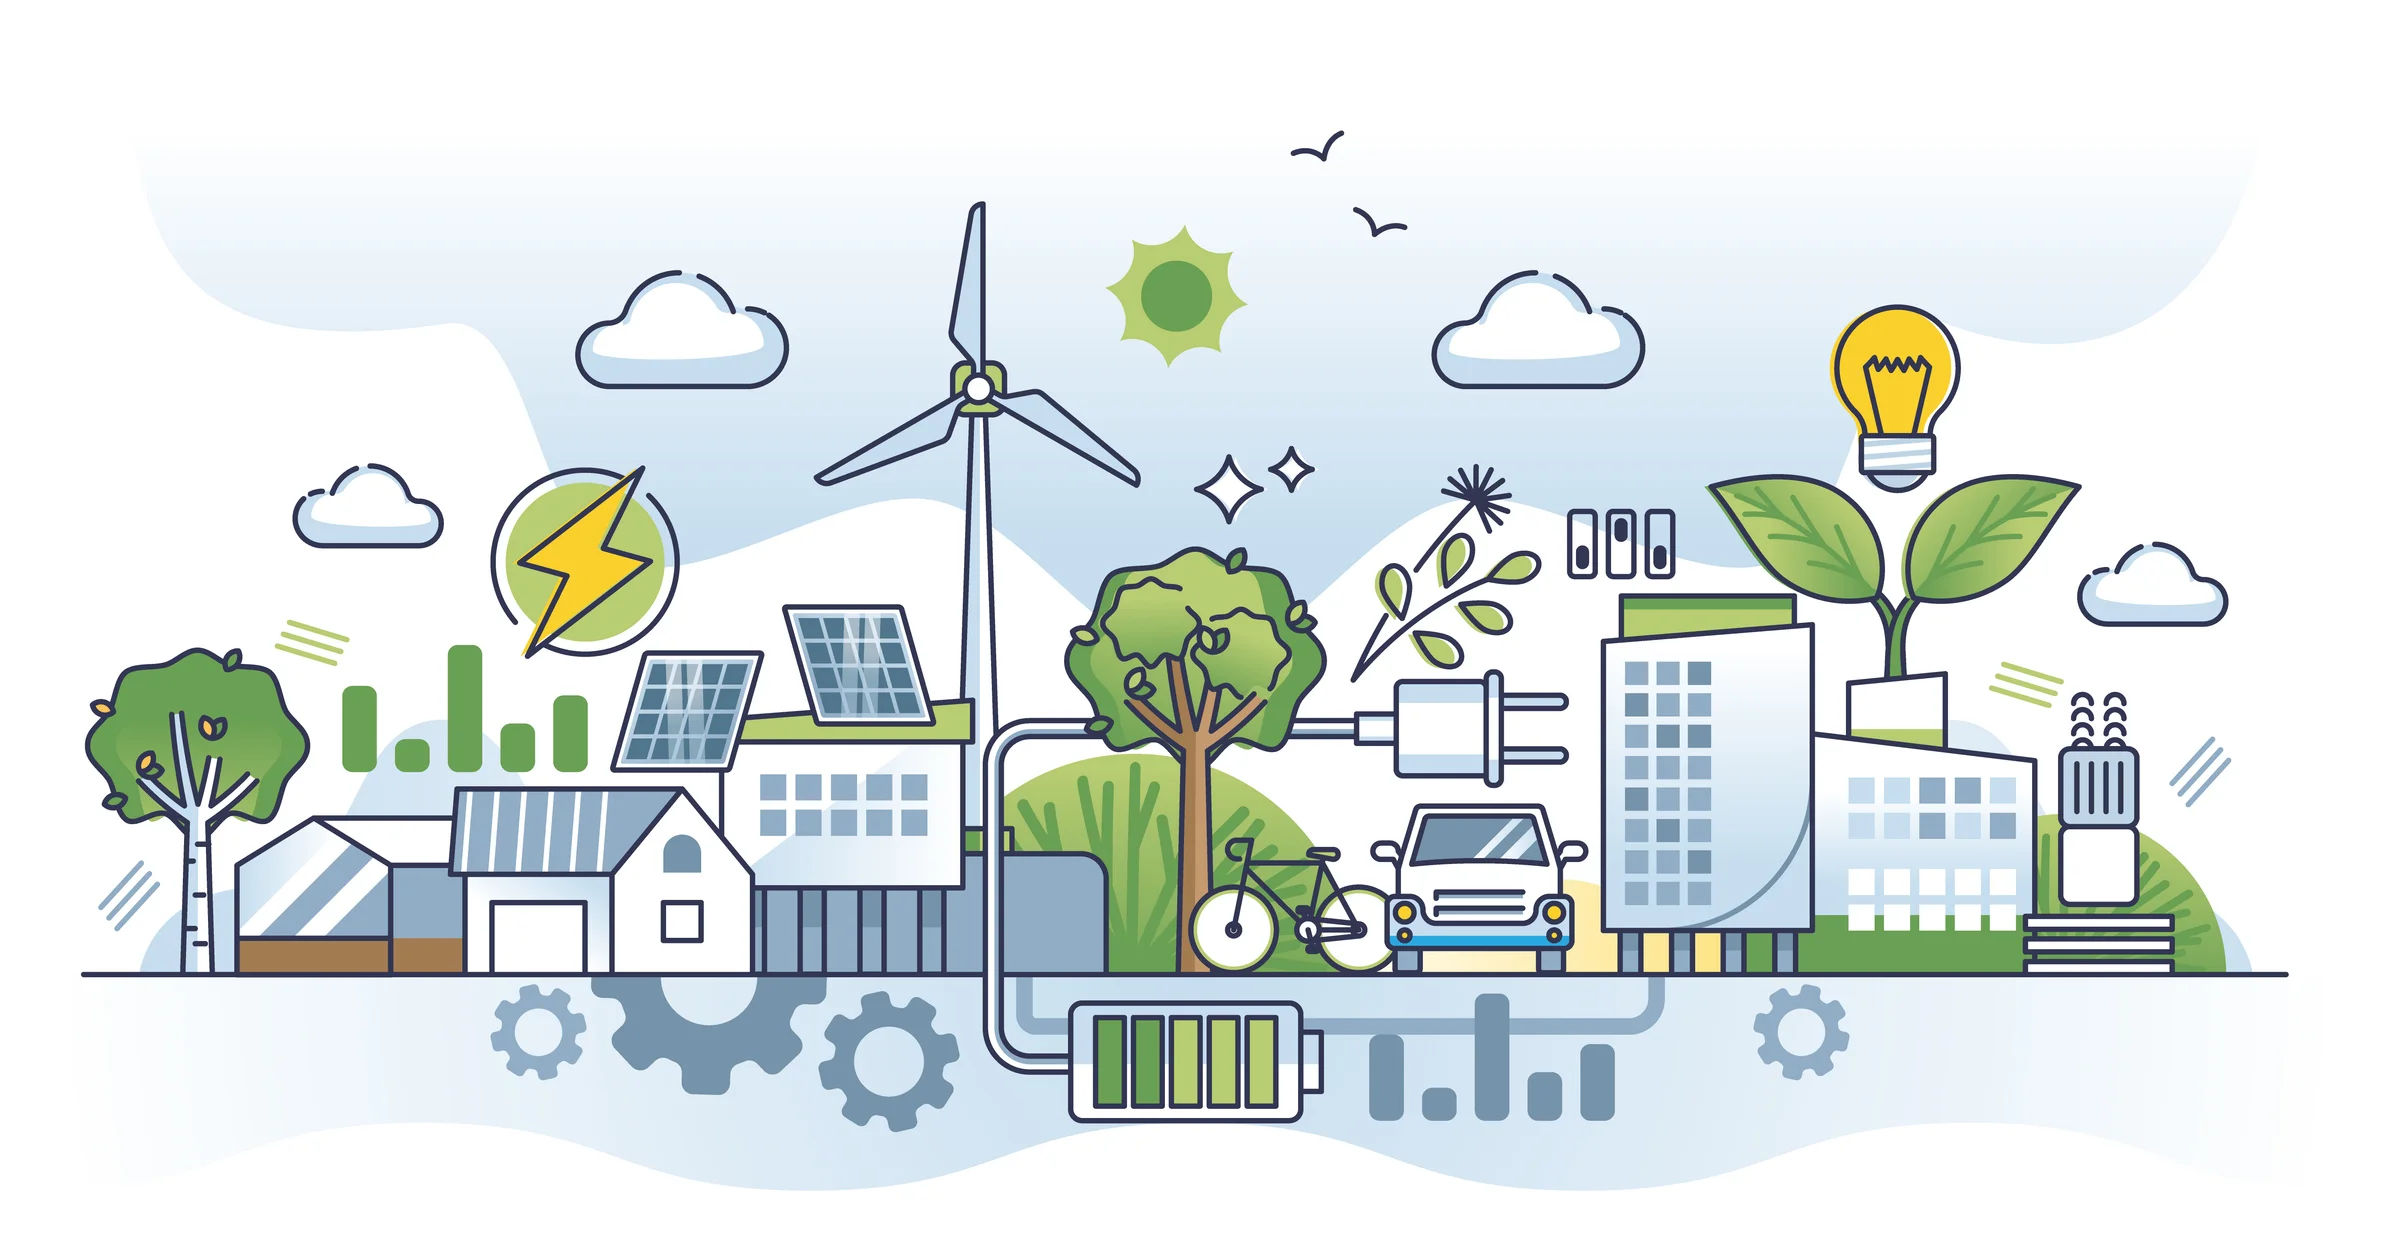
Each day, utility operators get their ducks in a row by studying the ebb and flow of electricity to ensure the safe and consistent delivery of service. By graphing peak demand and available renewable energy, program managers can measure potential imbalances in generation, a necessary step in enhancing grid resiliency and efficiency. Aptly named the “duck curve,” this graphical representation sheds light on the challenges and opportunities utilities face as they navigate the evolving landscape of renewable energy integration.
What is the Duck Curve?
The duck curve gets its name from its distinctive shape, resembling a duck’s silhouette. This curve represents the net load on the grid, which is the difference between electricity demand and the available supply. The duck curve gained prominence in the context of the increasing adoption of solar power, particularly in regions with a high concentration of solar installations.
The curve typically has two main features:
- Morning Ramp: The head of the duck corresponds to the early morning hours when electricity demand is high, but solar generation is still minimal. As the sun rises, traditional power sources (often fossil fuels) are utilized to meet the rising demand.
- Evening Ramp: The belly of the duck illustrates the evening hours when the sun begins to set and electricity demand peaks due to increased household activities. As solar production decreases, utilities must rapidly adjust to meet the rising demand, leading to a stark increase in the net load.
Why Does the Duck Curve Matter?
The duck curve poses a unique set of challenges for utilities, primarily stemming from the variable and intermittent nature of renewable energy sources, such as solar power. Traditionally, power grids were designed to handle a predictable and steady flow of electricity from conventional sources. However, the growing penetration of renewable energy introduces a level of unpredictability that requires innovative solutions.
Let’s look at a few key implications that the duck curve helps utility program managers understand.
- Grid Flexibility: The duck curve underscores the need for increased load flexibility to accommodate the variability in renewable energy production. Utilities must be able to rapidly ramp up or down conventional power sources to balance the grid in response to changing solar generation.
- Energy Storage: Storage technologies, such as batteries, are now and will only become more so essential in mitigating the impact of the duck curve. Storing excess energy during periods of high renewable generation and releasing it during peak demand helps smooth out the curve and ensures a stable power supply.
- Demand Response: Encouraging consumers to shift their electricity usage to times of abundant renewable energy can help align demand with supply. Time-of-use pricing and smart grid technologies enable more dynamic demand response strategies.
- Policy & Regulation: Policymakers play a crucial role in shaping regulations that incentivize the adoption of clean energy technologies and grid modernization. Supportive policies can encourage the development of a more resilient and sustainable energy infrastructure.
Strategies for Managing the Duck Curve
Addressing the challenges posed by the duck curve requires a multifaceted approach. Fortunately, distributed energy resources (DERs) present opportunities for utilities to enhance grid resiliency, while defraying high energy costs during periods of peak demand. Below are a few such opportunities:
- Advanced Grid Management: The integration of advanced grid management technologies, including smart grids and predictive analytics, enables utilities to anticipate fluctuations in renewable energy production and proactively manage the grid.
- Demand-Side Management: Utilities are exploring demand-side management strategies, including time-of-use pricing and smart home technologies, to incentivize consumers to shift their electricity usage to high renewable energy production times.
- Diversification of Energy Sources: A diversified energy portfolio that includes a mix of renewable sources, combined with improved forecasting and grid management, can help mitigate the impact of the duck curve.
Navigating the Duck Curve Conclusion
As the world transitions towards a more sustainable and renewable energy future, utilities must grapple with the challenges represented by the duck curve. The integration of renewable power into the grid presents both opportunities and hurdles, necessitating innovative solutions and a collaborative effort between utilities, policymakers, and consumers. By addressing the implications of the duck curve head-on, the energy industry can pave the way for a resilient, flexible, and environmentally conscious power grid.
Virtual Peaker Can Help Your Utility! Watch & Learn How!