Writing and researching the energy sector reveals one particularly frustrating truth: it’s almost impossible to find comprehensive data about the industry in one place. And while we may not be able to find every single statistic that you need to inform your demand flexibility initiatives, like demand response, EV charging, or virtual power plants, we can collect as many resources as possible and share them in one handy, living blog that will be updated as more data becomes available. Read on to learn more about everything from the age of the grid to the cost of upgrading it and beyond.
Grid Statistics
The grid statistics section examines the general features of the grid, including age, cost to replace/upgrade the U.S. grid, projected load growth, and more. Demand flexibility initiatives serve to mitigate the challenges of an aging grid by shifting energy to off-peak periods of usage through aggregate conservation and/or the redistribution of existing, communally-generated ambient solar and battery energy.
- Age of the Grid – The average age of the grid is between 50-60 years old.
- Projected U.S. Electric Load Growth – Load growth is projected at a 2% annual trajectory
- The Health of the U.S. Grid – The American Society of Civil Engineers gives U.S. Infrastructure a ‘C’ Grade in their 2025 Report Card for America’s Infrastructure.
- Cost to Upgrade the Grid – Analysts estimate a cost of over $2.5 trillion by 2035 to upgrade the U.S. electric grid.
- The Cost of Building a New Power Plant vs. a Virtual Power Plant – The cost to develop a virtual power plant is 40% to 60% the cost of alternative options.
- Cost to Bury Lines – The cost to bury power lines underground varies by state. One study on California found that it would cost approximately $559 billion to convert all 147K miles of overhead distribution lines in the state of California in 2019 dollars, unadjusted for inflation.
- Grid Interconnection Queue – The grid interconnection queue defines the length of time that it takes to connect new developments to the grid. Currently, the average wait time is approximately 5 years.
- Infrastructure Bottlenecks – The U.S. is experiencing supply chain shortages of 30% and 10% of power and distribution transformers in 2025.
- Delivery of new transformers can take up to three years as of Q4 2025.
Industry Statistics
The U.S. electric utility industry is unique, as individual utilities operate by different principles. As such, finding broad industry stats to help inform the potential of any demand flexibility program is often limited or disparate, the subject of any number of organizations or associations that monitor and track industry data. Still, knowing the most common types of electricity, access to the internet, and more is useful in determining the need or potential efficacy of a demand flexibility program.
- Access to Broadband Internet – The Federal Communications Commission reports that as of 2022, 110 million homes and small businesses have broadband access.
- U.S. Electricity Generation by Source – Data pulled from available information from 2023.
- Natural gas – 60%
- Coal – 16.2%
- Nuclear – 18.6%
- Renewables – 21.4%
- Electricity Usage in the U.S. – The U.S. produced more than 103 quadrillion BTUs of energy in 2024.
- Demand is Increasing – Demand has risen by 13% between 2022-25.
- Projected Electricity Demand in the U.S. – The U.S. Energy Information Administration projects residential electricity consumption will grow at an average rate of 1.7% per year, and commercial and industrial electricity usage will grow at an average of 2.6% and 2.1% per year.
Distributed Energy Resource (DER) Statistics
By leveraging behind-the-meter distributed energy resources (DERs) like solar, battery energy storage systems (BESS), electric vehicles (EVs) and EVSE chargers, and smart home devices like smart thermostats and water heaters through the use of a distributed energy resource management system (DERMS), utilities can aggregate and manage otherwise disparate devices for use in demand flexibility initiatives like what’s mentioned above. Through the use of a Grid DERMS, utilities can manage utility-held distributed energy resources (DERs) like solar and battery installations, while Grid-Edge DERMS manage the very same DER assets proliferating in places like residential, commercial, and industrial properties.
Smart Thermostats
- Smart Thermostat Adoption Rate – More than 16% of U.S. homes have smart thermostats.
- Smart Thermostat Projections – Smart thermostat installations are projected to reach 38.3 million by 2026.
- The Smart Thermostat Market – The smart thermostat market is projected to achieve sales of 8.1 million units by 2030.
Electric Vehicles
- Electric Vehicle (EV) Market Penetration – EVs accounted for 9.2% of all vehicle registrations in the U.S. in 2024.
- EVs on the Road – There are approximately 4 million EVs on the road in the U.S. as of 2024.
- EV Sales – Global EV sales increased by 20% in 2024; Q1 2025 EV sales were up 35% compared to Q1 2024.
Battery Energy Storage Systems (BESS)
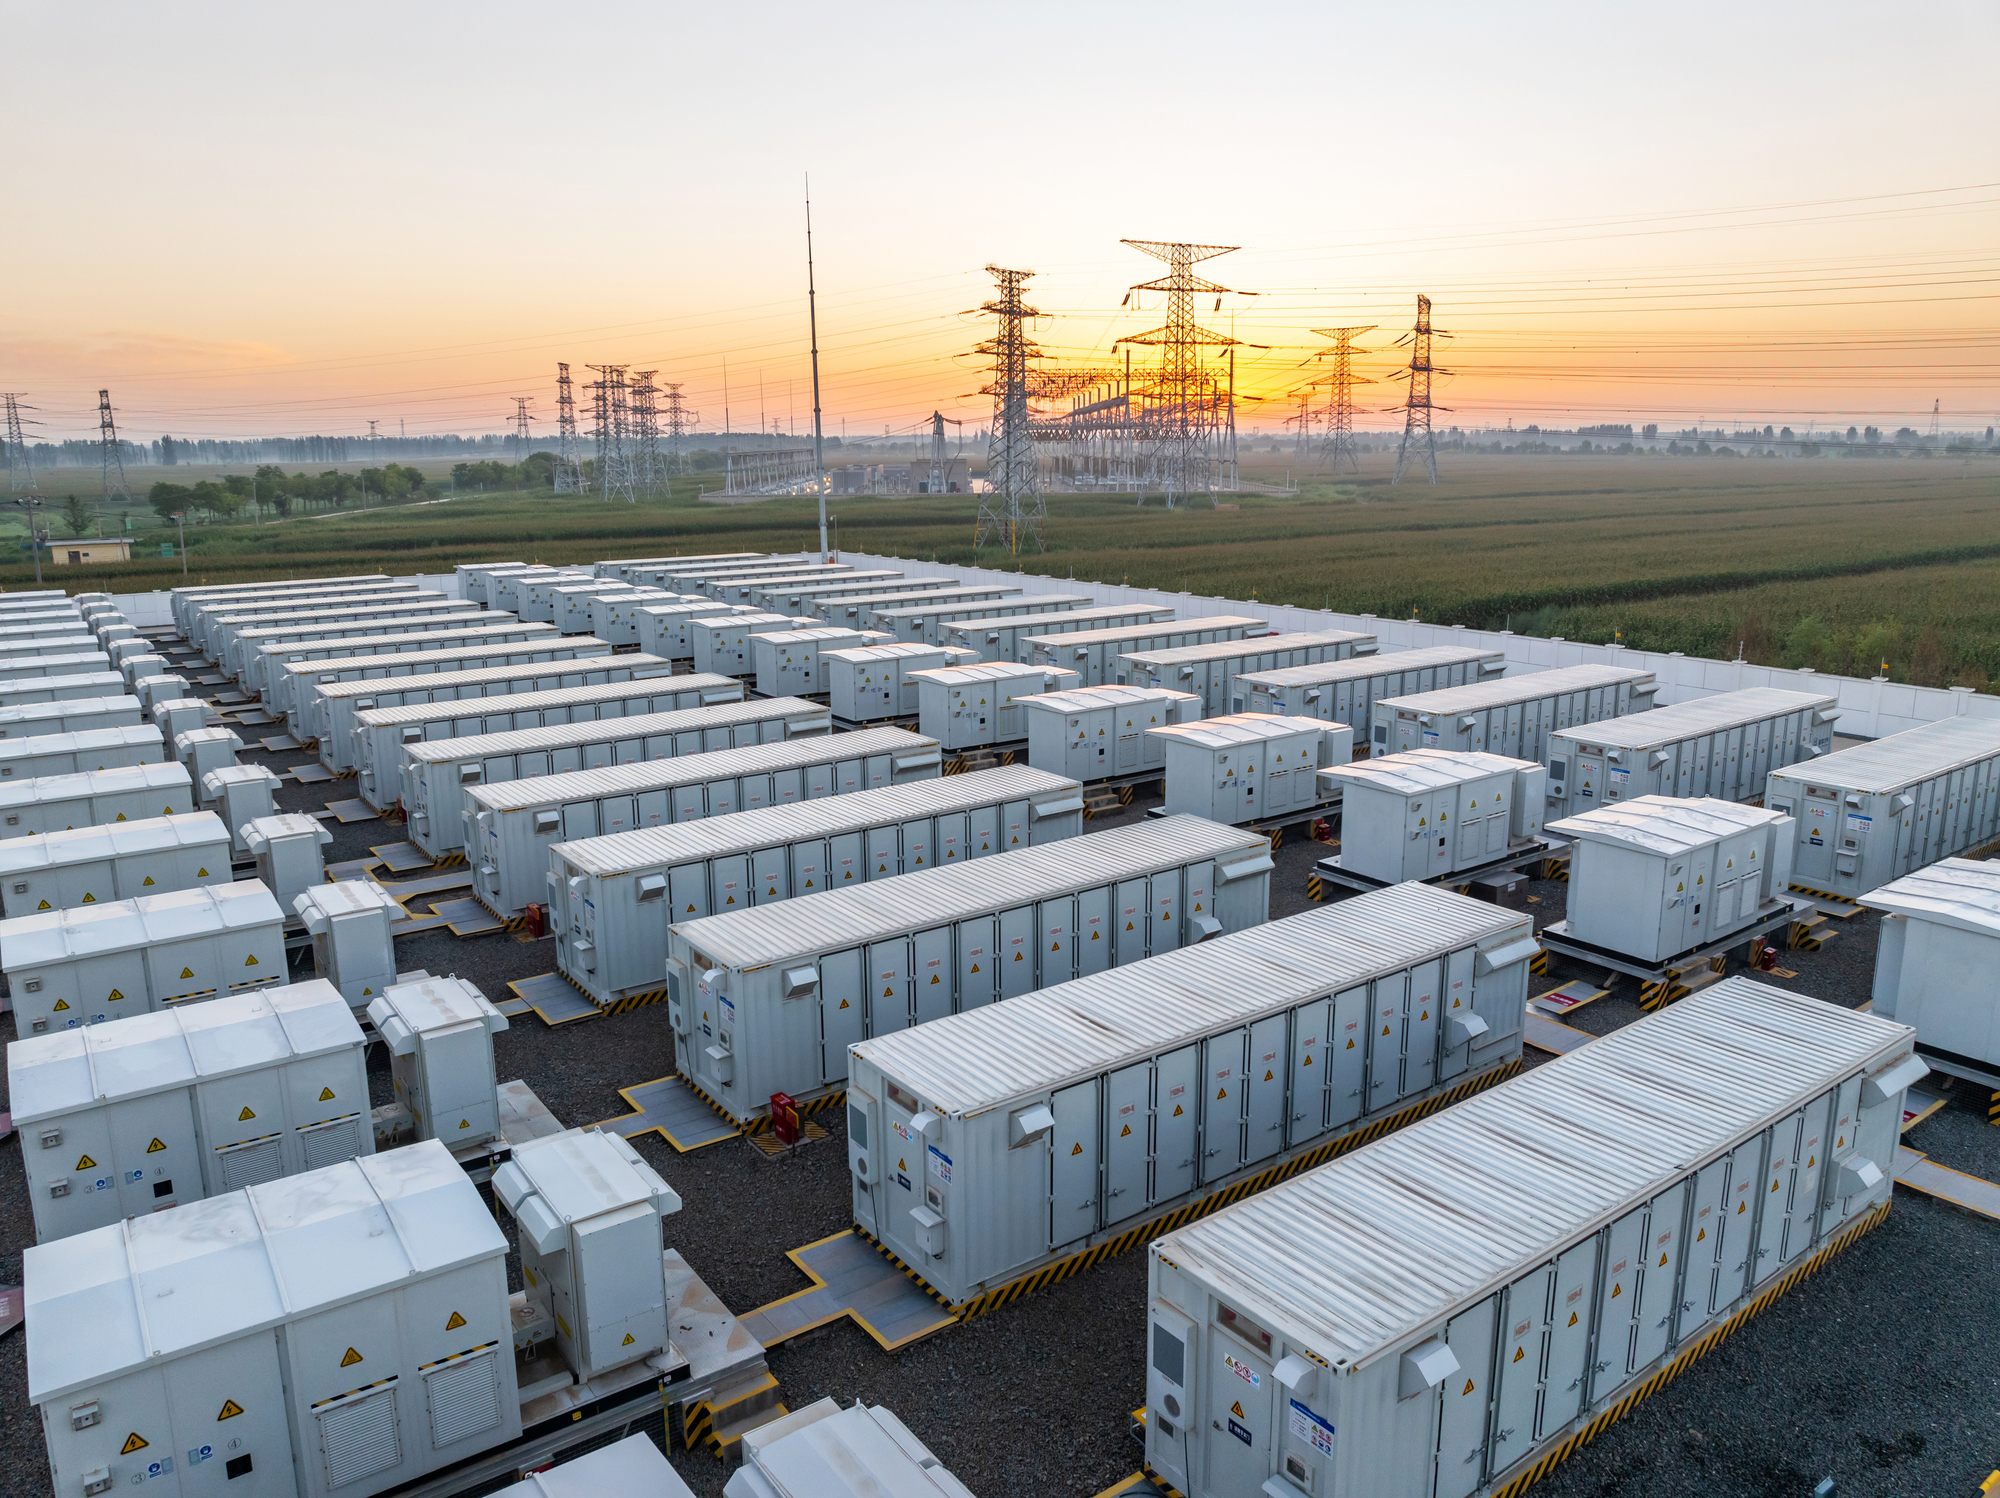
- U.S. Battery Capacity – U.S. battery capacity increased by 66% in 2024, exceeding 26 gigawatts of utility-scale battery storage capacity.
- Investments in BESS – Investments in battery storage and power grids surpassed $450 billion in 2024.
- BESS Deployments – Annual energy storage deployments expanded by more than 9 GWh between 2023 and 2024 (a 34% increase).
Solar Panels
- Solar Panel Market Penetration – There are 5 million solar installations in the U.S.
- The Potential of Utility-Scale Solar Farms – Utility-scale solar farms have a total capacity of 100 GW, enough to power 22 million homes.
- Utility-Scale PV Capacity – The U.S. has a cumulative installed utility-scale photovoltaic solar capacity of 80.2 GW across 47 states.
- The Future of Solar – U.S. developers project that half of all new electric generation capacity will come from solar.
- Residential Solar – Approximately 7.5% of U.S. residential homes have solar installed.
- Small-Scale Solar – U.S. small-scale solar installations—including residential solar—accounted for approximately ⅓ of all U.S. solar power capacity in 2024.
Customer/Member Service & Engagement Stats
Renewable energy projects like demand flexibility programs thrive the more people enroll and participate. Lowering barriers for access to these programs while educating and incentivizing enrollment and participation is crucial to developing and scaling any renewable program. Let’s look at a few stats that speak to that potential.
- The State of Electric Prices – Consumer electricity prices have risen 13% on average between 2022-25.
- 39% of surveyed customers reported being worse off in 2024 as compared to 2023.
- Demand Response Participation – There were 10.3 million devices enrolled in residential demand response in 2022, yielding 1 terawatt hour of electricity.
- Customer Willingness to Enroll & Participate in Demand Response Programs – 63% of customers surveyed expressed an interest in demand response, even without incentives.
- While 16% of households have internet access and smart thermostats, only about 20% participate in demand response programs as of 2025; 54% of non-participants cited that they did not know that demand response programs were available.
- 70% of customers polled in the 2025 State of the Consumer Report from the Smart Energy Consumer Collaborative (SECC) report that they have received energy messaging from utility providers.
- Customer Awareness of Demand Flexibility Events – Parks Associates notes that 35% of today’s consumers report they barely noticed a difference when a DR event was called.
- The Efficacy of Incentives – Financial incentives work to drive enrollment, as 60% of DR participants signed up because they liked the incentive, compared to 33% who signed up due to power outage concerns or to help the community generally
- Customer Values – Research suggests that 75% of consumers value transparency.
- Brand trust is 5% higher for utilities that invest in their communities, meaning more customer buy-in.
Climate Change Statistics
Climate change directly impacts the electric utility industry by driving the electric demand needed to properly cool and heat properties. These pressures raise operational costs, from high energy market costs to damaged physical infrastructure. Demand flexibility programs help defray these concerns by offering non-wires alternatives to conventional energy management and load shifting, while supporting cost-saving efforts through aggregate conservation.
- Temperatures on the Rise – The last decade of temperatures has been the highest in recorded history; Earth’s global temperature was 2.3 degrees Fahrenheit warmer than the average baseline temperatures of the 20th century.
- The World Meteorological Organization found that there is a 70% chance the temperature average will exceed 1.5 ºC between 2025-2029.
- Greenhouse Gases – The amount of carbon dioxide, a greenhouse gas that traps heat from sunlight, expediting warming of the planet, in the atmosphere has risen dramatically over the last 100 years, with CO2 levels 150% more so than before the industrial revolution.
- The Cost of Climate Change – Climate change costs $182.7 billion in the U.S. in 2024; Climate change has cost more than $2.9 trillion over 403 qualifying events since 1980.
- Climate Change & Consumer Energy Costs – Economists estimate that net energy costs to consumers will increase by 10% to 22% due to higher temperatures.
All The Energy Sector Stats You’ll Ever Need: Conclusion
These statistics demonstrate the complexities and challenges of the energy industry. More so, research supports that energy insecurity is high and that both customer and operational costs are rising. While demand flexibility initiatives or distributed energy resources alone are unlikely to rectify these challenges, they can help better position utilities to increase grid resiliency, defray operational costs, and enhance customer satisfaction.
And as we learn more, we’ll share! Bookmark this page and expect routine updates to our content as we learn more. We all work better together as a community than apart, so let’s share our resources today for a brighter tomorrow.


